
The Dynamics 365 Finance and Operations Excel Add-In has greatly improved since earlier AX 2012 versions. The Excel Add-In in AX 2012 was very fickle and buggy to say the least. In Dynamics 365 Finance and Operations (D365) Microsoft has built the Excel Add-In on top of the data management framework, utilizing data entities to retrieve, update, and add data to D365.
The improved Excel Add-In has some new features that I have not seen deep coverage on and in this article, I aim to show you some of the coolest features and tips I have come across while working with it.
Later in the article you will see how, using the tools that we discuss in this article, you can create amazing visual dashboards connected directly to Dynamics 365 Finance and Operations without paying for a Power BI license or writing a single line of code!
How To Open Excel Add-In
On various forms, list pages, and grids you will find a Microsoft office icon shown below.
On some list pages and forms when you click this icon you will see drop down that shows two options. One option header will be “Open in Excel” and the other option header will be “Export to Excel”.
“Open in Excel” means that there is a data entity which you can connect to using the Microsoft Excel Add-In. This creates a dynamic connection to the data entity which can be used to update, create, and refresh data to and from the system.
“Export to Excel” will launch a static export of the selected data to Microsoft Excel and does not contain any of the functionality that will be described in this article. For the purposes of this article I will focus my attention on the “Open in Excel” functionality.
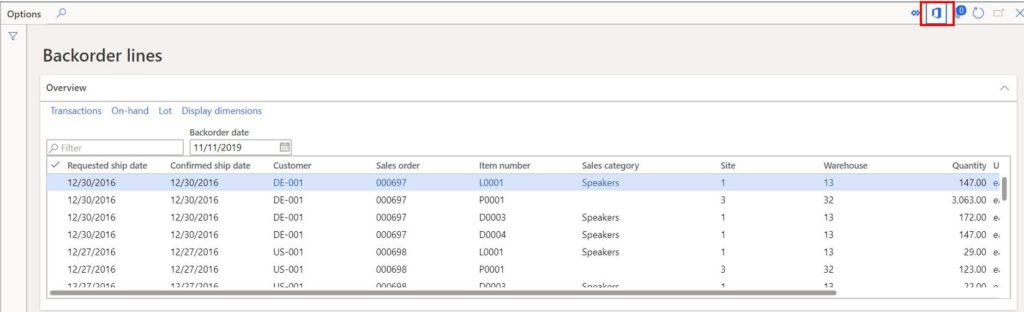
In this first example I will use the “Sales Order Lines V2” found in Sales and Marketing > Sales orders > Open orders > Backorder lines.
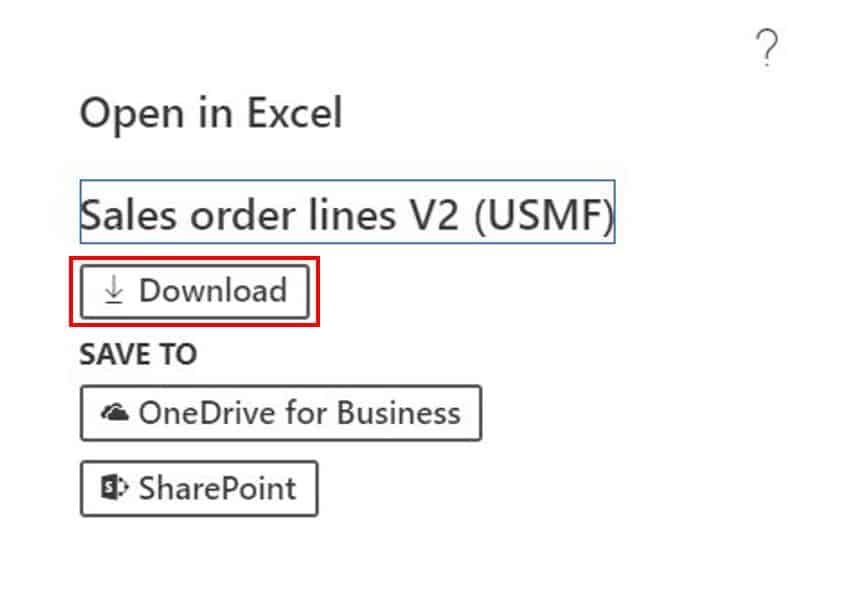
- To use the Excel Add-In navigate to your desired data set and click the Microsoft Office icon. Click the data entity you want to connect to using the Excel Add-In and make sure you select the option under the header “Open in Excel”.
- Click the “Download” button on the dialog to download the excel workbook.
When the workbook finishes downloading click the Excel document to open the document. I am using Chrome so yours may look a little different depending on the browser you are using.
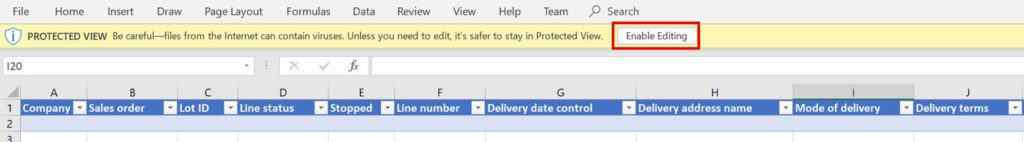
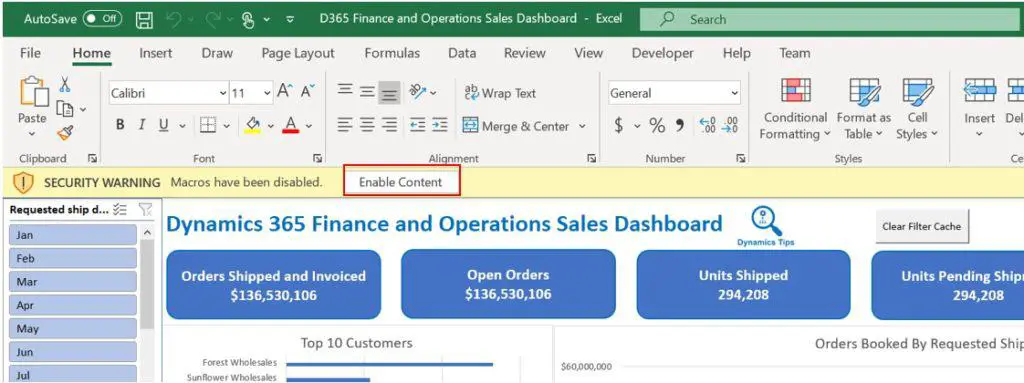
To enable the Add-In click “Enable content”.
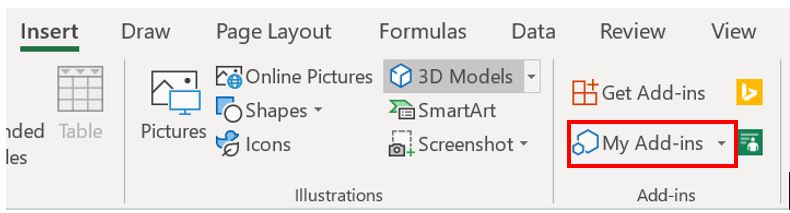
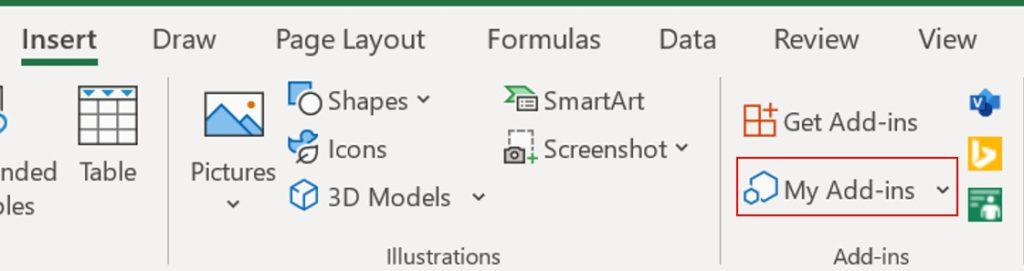
- If this is your first time using Excel Add-In you may need to enable the add-in by clicking the “Insert” tab in the Excel ribbon and click “My Add-ins”.
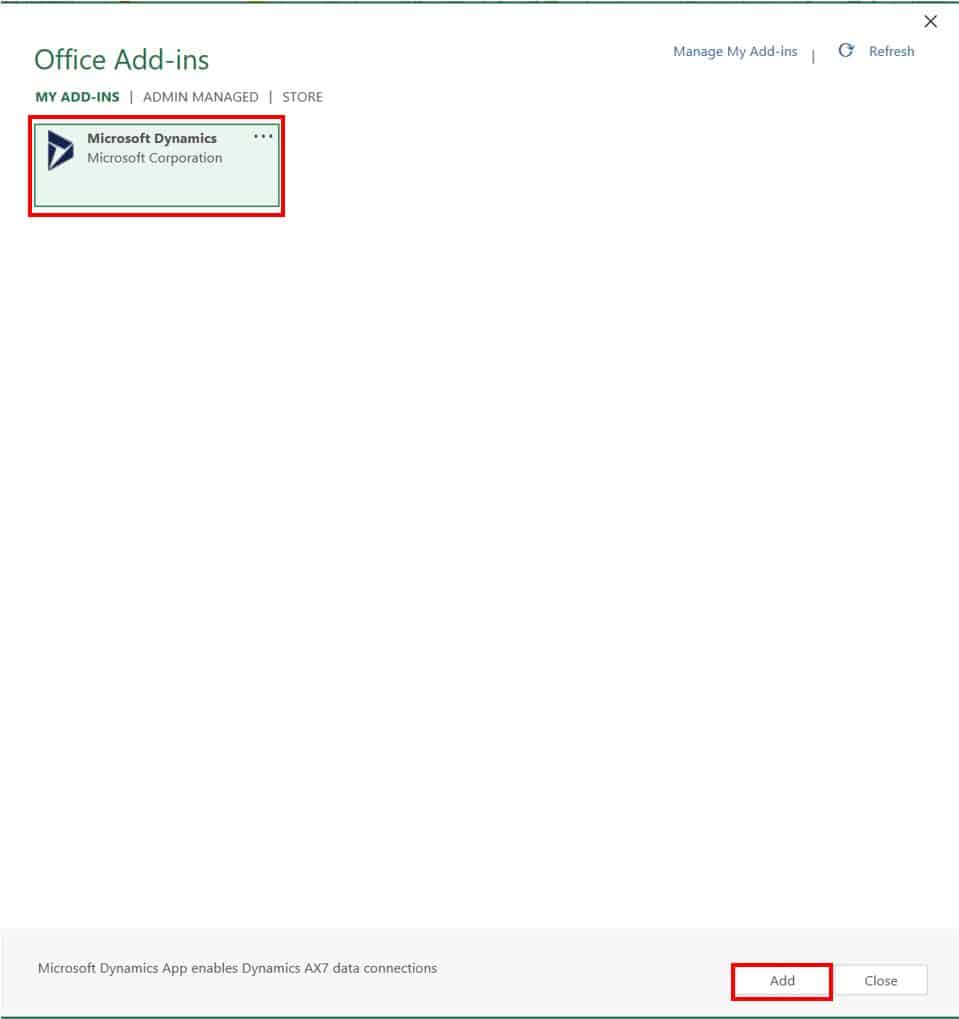
- Then select the “Microsoft Dynamics” Add-In and click “Add”.
The Excel Add-In may also ask you to sign in if this is the first time you are using it. Just sign in using the same credentials you used to log into D365.
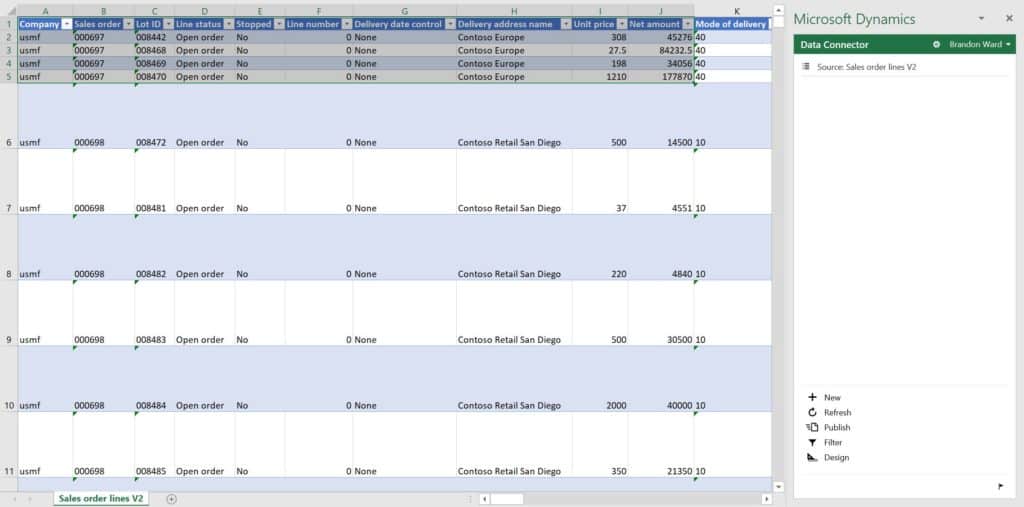
Once you do this you should see all of you data populated in the spreadsheet. Getting the data in the spreadsheet is great but there is so much more you can do read on to find out.
Update Data
The Excel Add-In functionality allows you to update data and since the updates occur through the data entity all CRUD (Create, Read, Update, and Delete) operations go through the standard D365 security framework and respect the user’s security role and security restrictions.
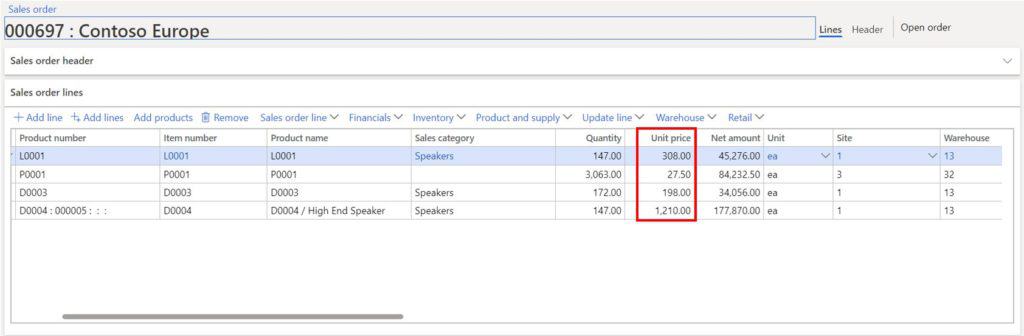
In the example below I want to update the prices of multiple sales order lines. So all I need to do is make the updates directly in excel and click the “Publish” button. You can see the number of records published and if you go back to the data in D365 you will see the data has been updated.
If I go into the system I can see the records I am going to be updating.
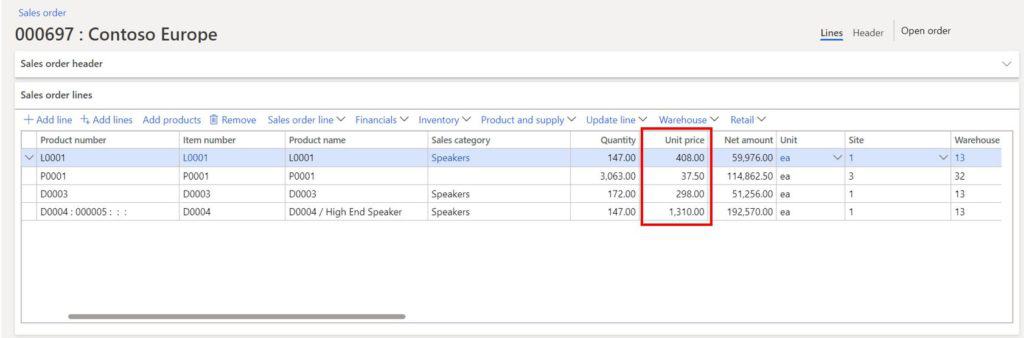
After I publish the data I can go back into D365 and refresh the form and I will see the published changes to the data.
Create Data
The Excel Add-In also enables you to create data. In the same Excel sheet, you can add a record and fill in the relevant and required fields and click the “Publish” button and publish records to D365. For more details on how to do this check out my article How to Load Data.
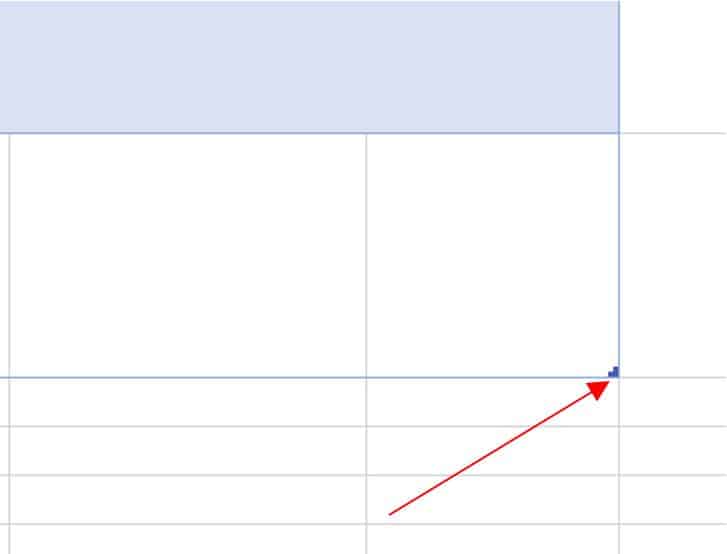
One tip I have picked up along the way is that if you add a record make sure you extend the table to include the new record. What I see sometimes is users add a record below the last row and try to publish it and they will get an error because the Excel Add-In does not see the new data. Drag the table edge as shown below to encompass the new record(s).
Filter
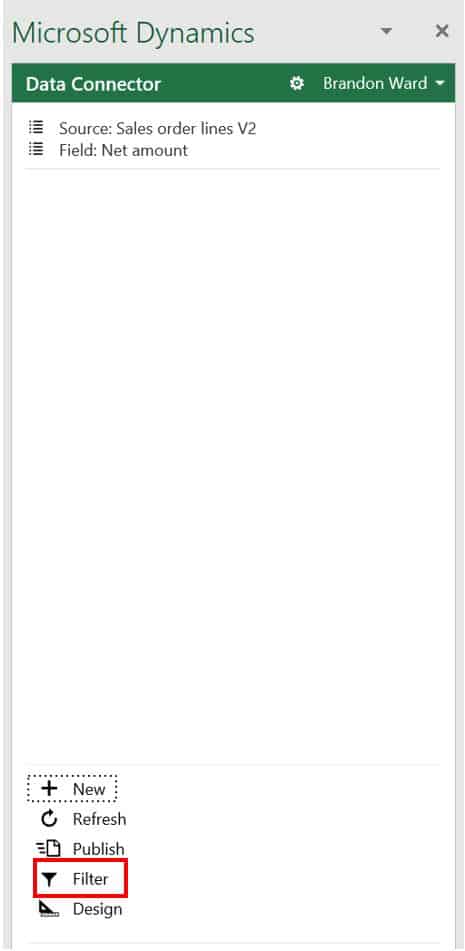
When you open the Excel Add-In and the data first populates in the Excel sheet the entity may be pre-filtered depending on which entity you connected to and the context where you clicked “Open in Excel”. For example, my “Sales Order Lines V2” entity is pre-filtered to just show sales order lines with status “Open order” which means the line has not been fully shipped. If I wanted to see all sales order lines or only shipped sales order lines, I can modify the filter to show me only the records I want to see. In this example I want to just remove the filter so I can see all the sales lines.
- To do this click the “Filter” icon in the data connector pane.
Click the trashcan icon to remove the filter and click “Done”.
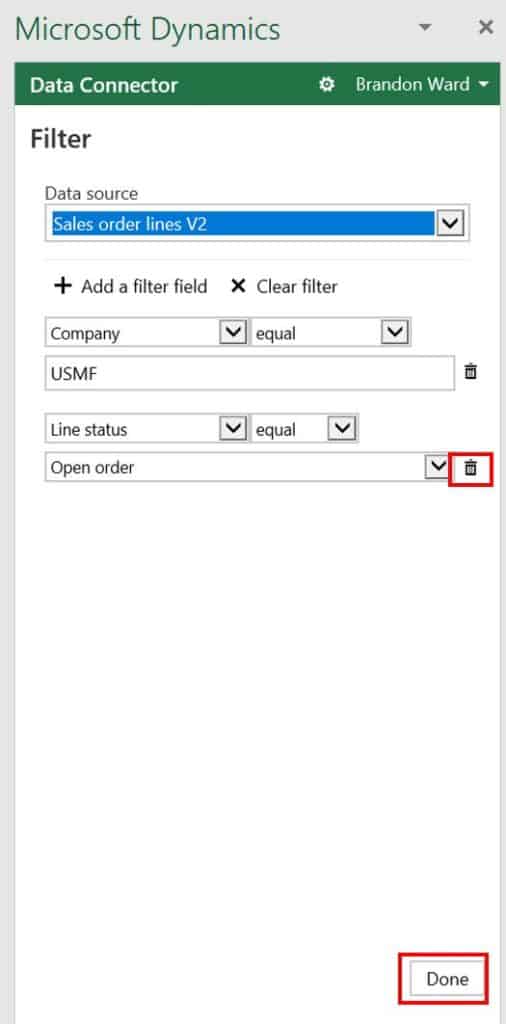
Click the “Refresh” icon to refresh the data and pull in the unfiltered data.
Modify Design
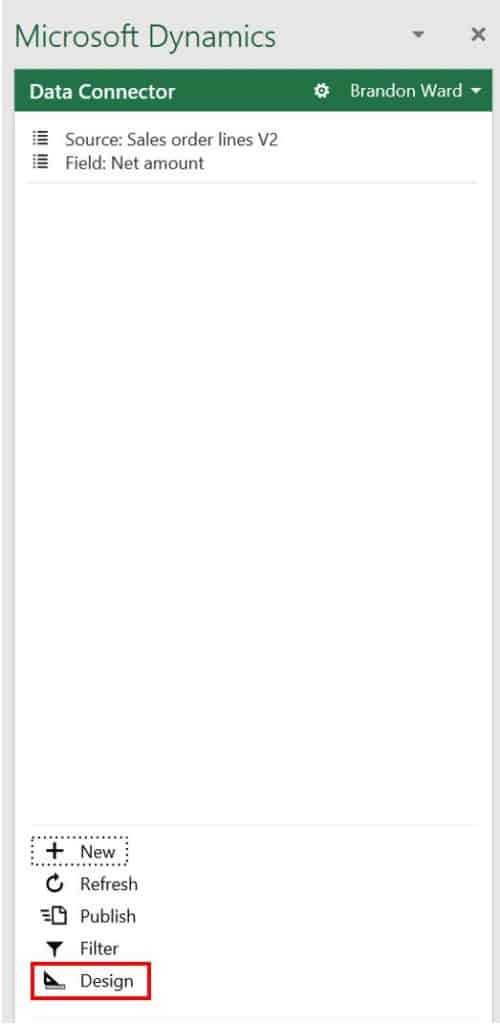
There are cases where you may want to add, remove, or rearrange the fields that are shown in the Excel sheet. You can do this by using the “Design” button in the data connector pane.
- Click the “Design” button in the connector pane.
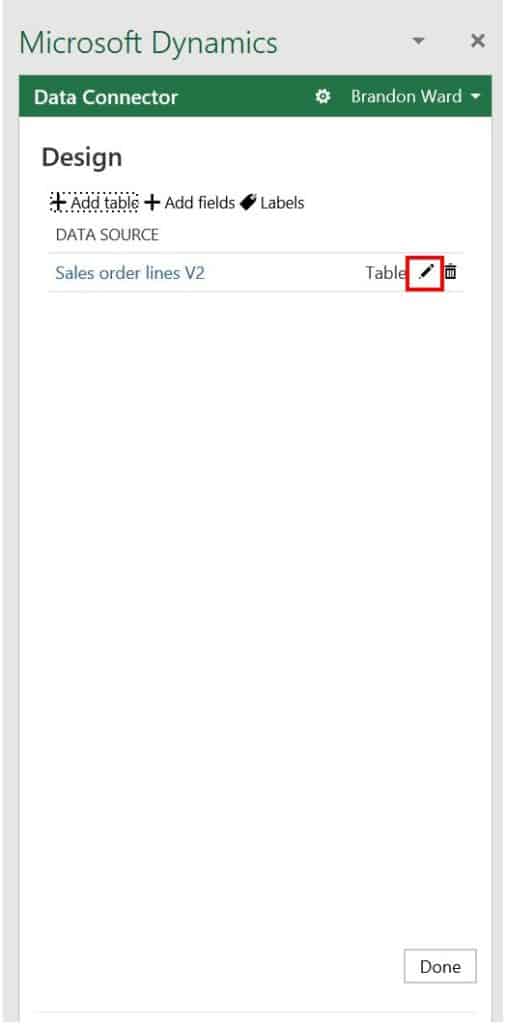
Click the “Edit” button in the connector pane.
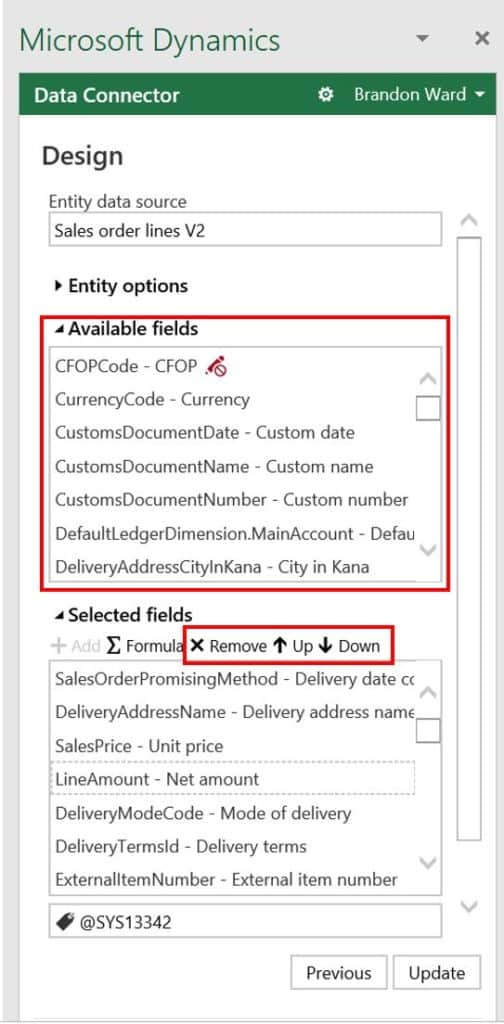
In the connector pane you will now see two sections. The upper section is called “Available fields” the lower section is called “Selected fields”. The selected fields are the fields you currently see in the Excel sheet.
- You can add a new field to the sheet but double clicking any field in the “Available fields” section. You will then see it appear in the selected fields section.
- You can order the fields in the way you want to see the fields in the Excel sheet by clicking on the field you want to move and click the “Up” or “Down” arrows. The fields at the top are displayed first in the Excel sheet. The first field will have the A1 position the second field will have the B1 position and so on.
- If you want to remove a field from the Excel sheet, simply double click a field from the “Selected fields” section or click the “Remove” button. You will then see the field move up to the “Available fields” section.
- When you’re done with your changes you can click the “Update” button and you will see the changes you have made reflected in the Excel sheet.
Create A Calculated Field
There may be cases where you want to use the power of Excel to create a calculated field. If you just create the manually create the calculated field in the Excel sheet you will lose the field when the data entity is refreshed.
- To create a calculated field that will bind to the data entity and remain intact after a data refresh, go to the design form as shown in the section above.
- In the design form click the “Formula” button.
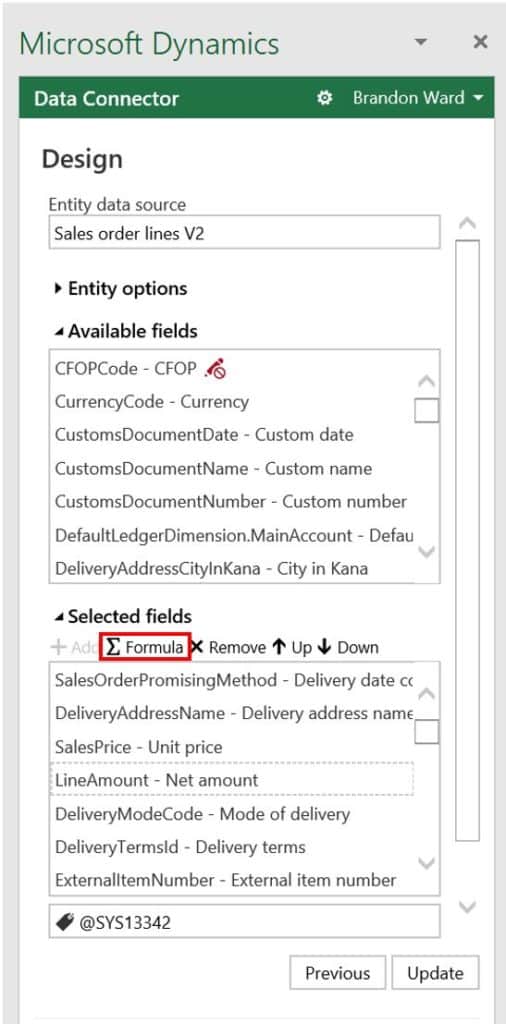
You will see a new column get created called “Column 1” you can rename this field by typing the label in the “Column label” field (with the tag icon).
- Click the “Update” button and you will now see your new field appear in the Excel sheet.
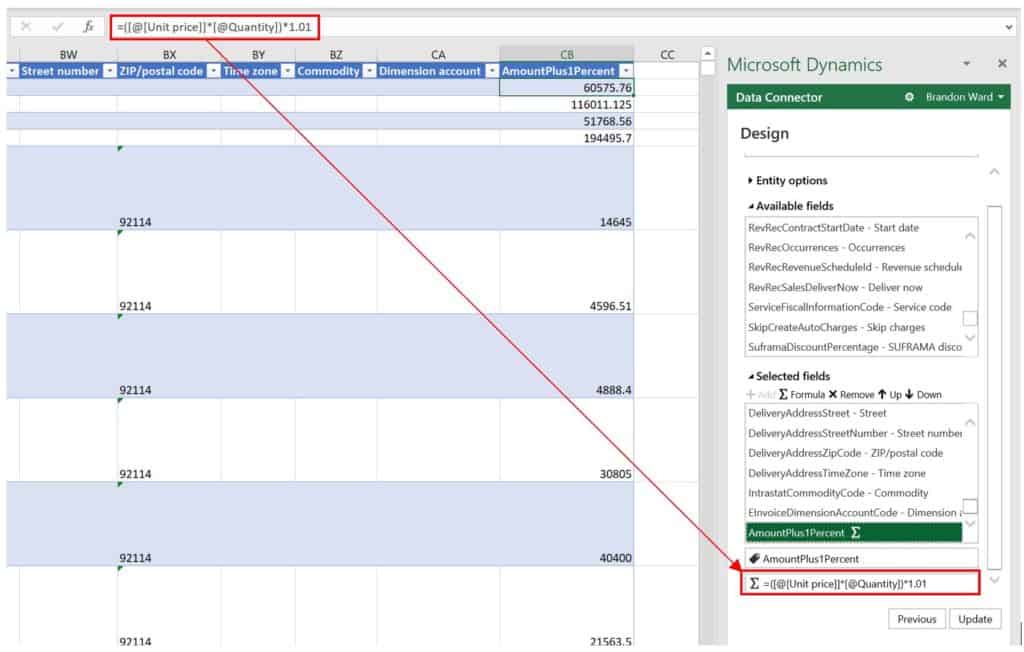
- Now what you can do is enter your formula in the Excel sheet and copy that formula into the “Formula” field (Sigma icon) in the connector pane.
- Then you just click the “Update” button and there you have it. You have a calculated field that will update along with the data you refresh directly from Dynamics 365 Finance and Operations.
Dynamic Reporting
Now that you’ve got you’re data, the fields you want, in the order you want them, and calculated fields you can save this file and save all the work you’ve done to your local computer or network drive. When you re-open the file it will automatically refresh the data in the file. How cool is that!? This enables what I call “Dynamic Reporting”.
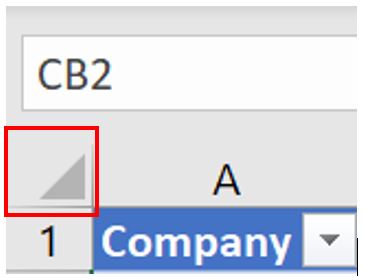
This means you could use the power of Excel to build sophisticated reports, KPI’s, and analytics to meet your business reporting needs. When you create your pivot or pivot chart make sure you use the select all triangle in the top left corner next to the A1 cell this will ensure that all new data is seen by your pivot or chart and all you need to do is refresh the pivot table to see the new data.
If you do not want the data to automatically be refreshed, you can change this in the data connector settings in the connector pane by clicking the “Settings” button.
Open the “Data connector” tab and un-check the “Refresh on open” option. Click “OK”.
Now the next time you open the spreadsheet, the data will not automatically refresh you will need to click the “Refresh” button in the data connector.
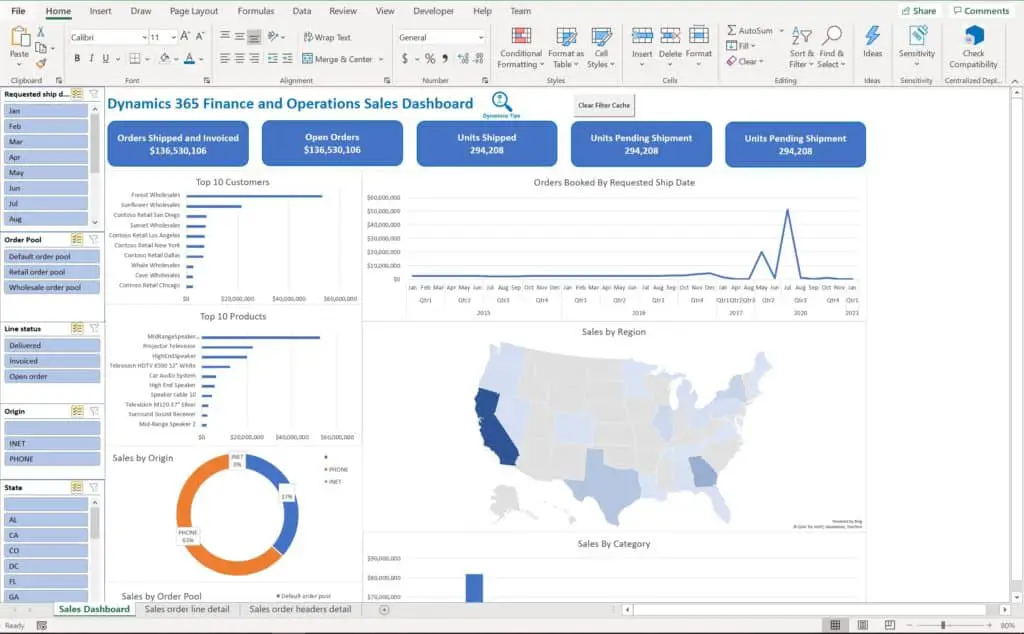
Build Dynamic Dashboards
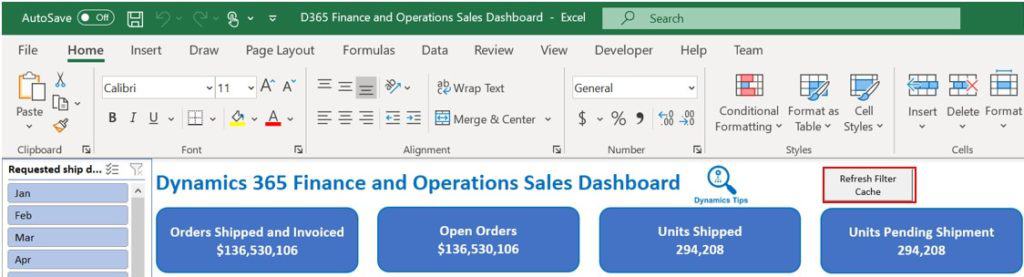
As you have seen, with Excel add-in you can bring in and build a dataset and then build multiple reporting visuals from that dataset to produce amazing interactive dashboards connected directly with the ERP. Below is an example of a sales dashboard that I built using all the tools we have discussed in this article. The dashboard contains 7 visuals and 5 summary totals all connected to slicers that control all visuals on the dashboard. These are all connected to pivot tables derived from a main dataset which is made up of a few standard data entities.
This was all done without a single line of code being written and without purchasing a Power BI license.
If you would like to purchase this dashboard, as a starting point or to use it as is, you can connect it directly to your environment, refresh it, and see what your data looks like in this dashboard. The workbook is completely yours after purchase. You are free to add, remove, and modify it as you wish. You can add custom fields, change report types or add new slicers. You can add your own company logo and brand it however you like. If you are not able to see the check out form please try using Edge or Chrome browsers.
Dashboard Instructions And Setup
After purchase the Excel file containing the dashboard will be emailed to the email account you enter during purchase. When you receive the email download the Excel file and if you receive a warning about content click “Enable content”. I have built in a macro that will automatically refresh all the filters with the new data you bring in.
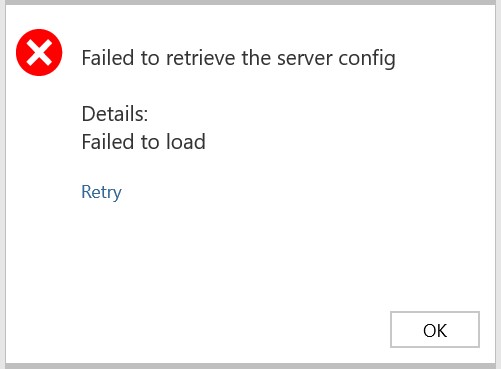
You will receive an error message at first saying “Failed to retrieve the server config” this is because you have not entered your environment “Server URL”. You can just click “Ok”, because we will enter that in subsequent steps.
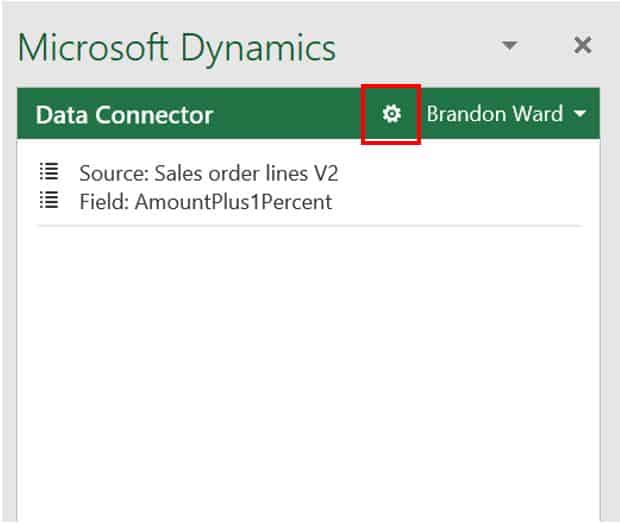
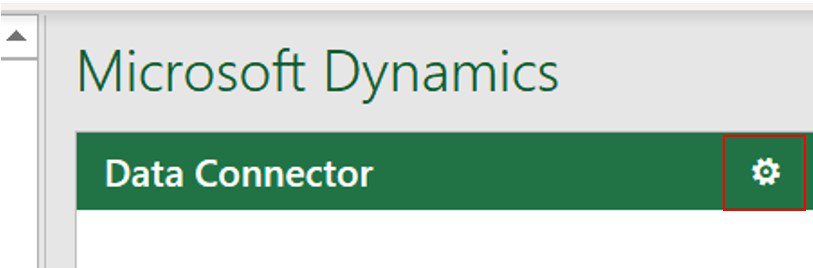
Next, we need to connect the dashboard to your D365 Finance and Operations environment. To do this use the Microsoft Dynamics Data Connector pane on the right hand side and click the gear icon.
The data connector pane should open automatically but if it does not, you can use what you have learned in this article and click the “Insert” tab in the Excel ribbon, click “My Add-ins”.
Next find the “Microsoft Dynamics” add-in and click “Add”.
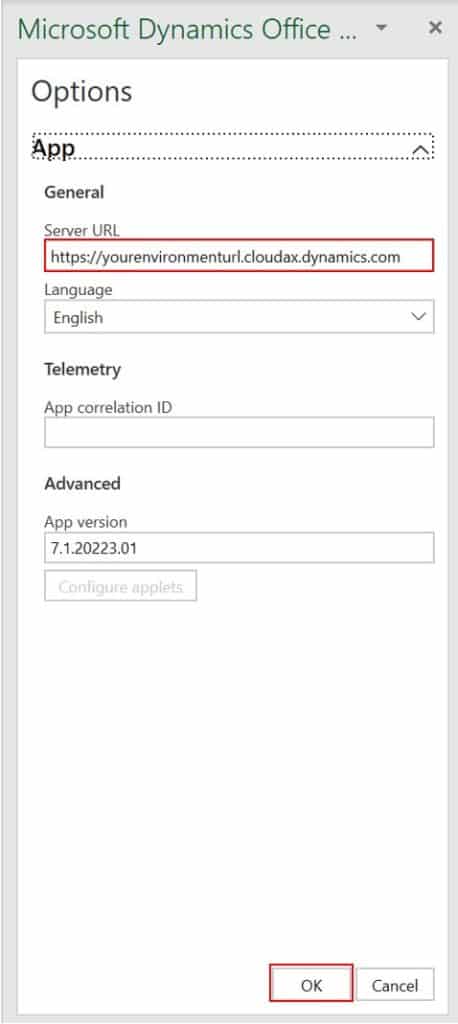
Now you should see the connector pane. Click the gear icon. In the “Server URL” enter the URL for your environment and click “Ok”.
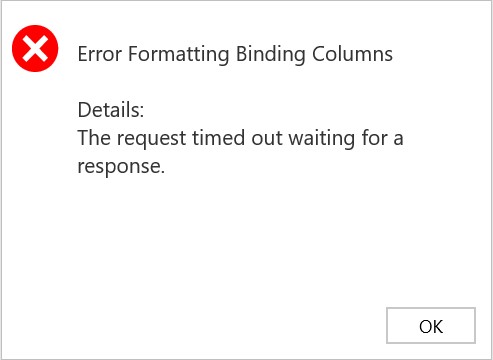
This will connect to your Dynamics 365 Finance and Operations environment and the spreadsheet will begin to populate with data. If you receive an error message saying “The request timed out waiting for a response” just click ok and press the “Refresh” button in the data connector again.
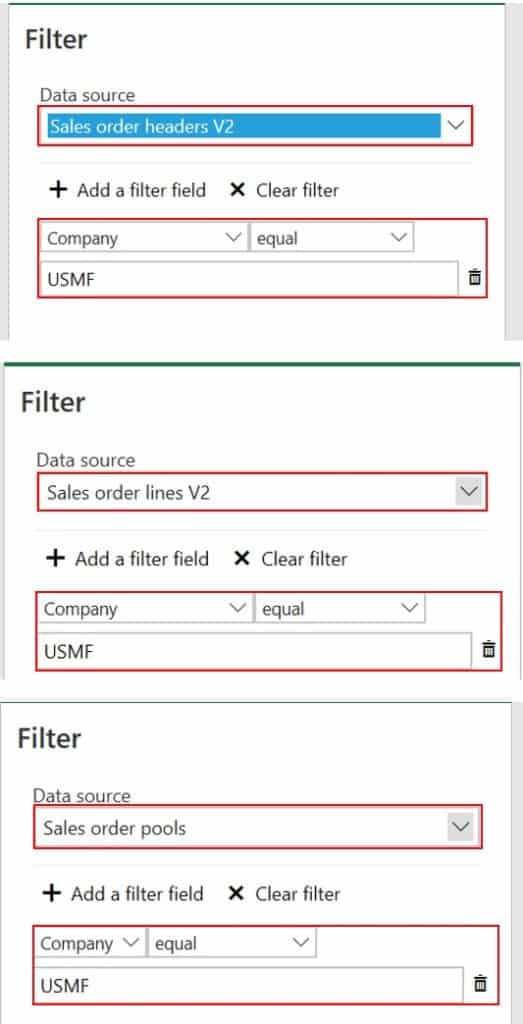
By default, I have pre-filtered the data coming into the dashboard to include only data coming from company “USMF” since this is Contoso demo data. You will need to change the filter for each data entity to be whatever company data you want to bring into the report. If you want data from all companies, you can just clear the filter entirely.
Go to the filter pane as you learned in this article and in the “Data source” field select each data entity and ensure that each one is filtering on the company you want to filter on. Again by default it will be set to “USMF”.
Once you have set your company filter you can click the “Done” button and then click “Refresh”. This will bring in your data into the dashboard.
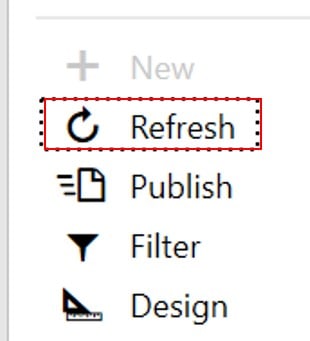
Now that you have your data in the dashboard the last step is to refresh all your chart filters. I built in an automatic refresh macro which refreshes all filters in the workbook. Click the “Refresh Filter Cache” button.
Now all of your data should be in the workbook. By default, all the pivot table tabs used for these pivot charts are hidden. If you want to modify any of them, just unhide the tabs and customize anything you like.
Troubleshooting
One Million Record Limit
If you have over a million records you will receive an error saying “The data retrieved has been limited to the cell refresh of 1000000 cells. Apply additional filters as needed”. If you get this you need to go back to the filters pane again and set some additional filters (maybe on “requested ship date” in the sales order lines v2 data entity) to reduce the number of records being brought into the workbook.

Slicer Disaggregation
In some cases, after refresh I have noticed that the date slicer disaggregates the dates into individual dates instead of by month. If you want to reaggregate them simply click on one chart, add the “Requested ship date” to the “Axis” of the pivot chart and then remove it. Excel will reaggregate it automatically.
Contact Us
If you are not able to get the dashboard to work with your environment please contact us and provide a detailed description of the problem you are experiencing and we will respond back with the appropriate steps to get it working. Support will only be provided to get the dashboard connected and working. Other inquiries will be deprioritized.
We cannot provide support if you have modified the dashboard in any way from its original form.
Takeaways
I hope you were able to see the power of the new Excel Add-In and how it can be used to not open manipulate data but also serve as a powerful reporting tool that can directly connect to the Dynamics 365 Finance and Operations ERP system.